
Calculate Inflation and Purchasing Power
Use the Inflation Calculator above to compare historical dollar values, price changes, and purchasing power, or estimate how inflation may affect future costs.
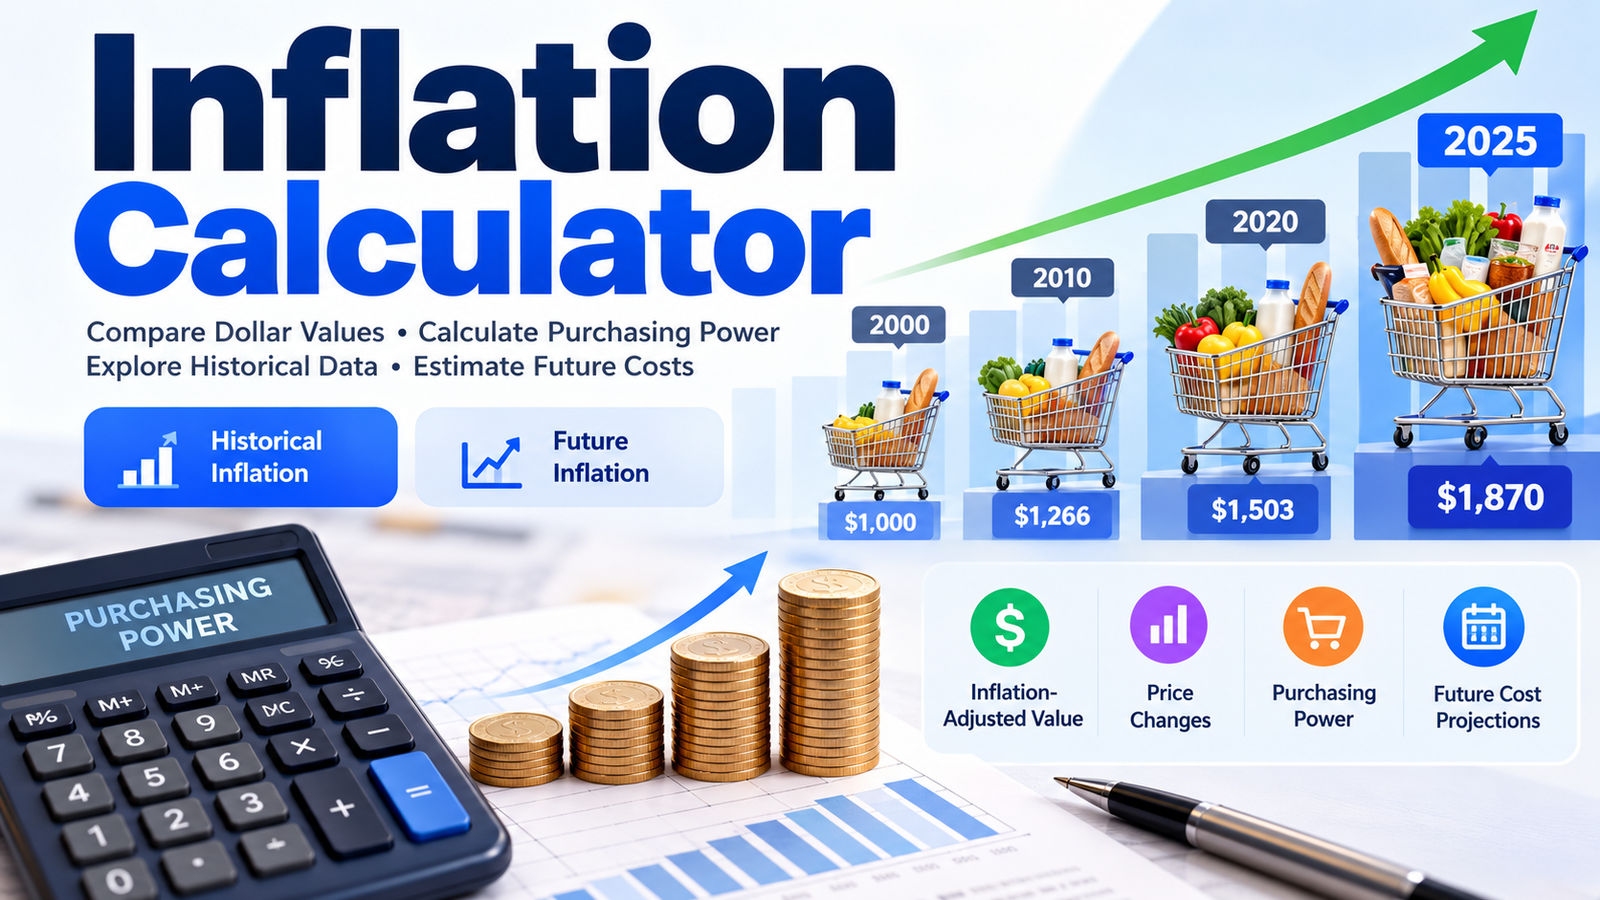
How to Use the Inflation Calculator
Our free Inflation Calculator helps you understand how the value of money changes over time. You can calculate historical inflation using US Consumer Price Index (CPI) data or estimate future price changes using your own inflation assumptions.
The calculator includes two modes: Historical Inflation and Future Inflation.
Historical Inflation Calculator
Use this mode to compare the purchasing power of money between two different years.
Step 1: Enter the Amount
Enter the dollar amount you want to compare. For example, enter $1,000.
Step 2: Select the Starting Year
Choose the year when your original amount had the purchasing power you want to measure.
Step 3: Select the Comparison Year
Choose the year you want to compare against. The calculator supports completed annual CPI data from 1913 through 2025, along with a separately identified September 2026 monthly observation.
Step 4: Calculate Inflation
Click Calculate Inflation to see the inflation-adjusted dollar value, cumulative inflation, annualized inflation when applicable, and purchasing-power change.
Future Inflation Calculator
Select Future Inflation to estimate how prices could change over time.
Enter your starting amount, expected annual inflation rate, and number of years.
The calculator displays the projected future cost, cumulative price change, and estimated purchasing power of an unchanged cash amount.
What Is Inflation?
Inflation is an increase in the general price level of goods and services over time.
When prices rise, each dollar generally purchases fewer goods and services than before.
For example, if an item costs $100 today and its price increases by 3%, it would cost $103 after one year.
If prices continue increasing, maintaining the same standard of living may require more money in future years.
Inflation can affect everyday expenses such as groceries, transportation, housing, medical services, and education.
However, individual prices do not always increase at the same rate. Some products may become cheaper even during periods of overall inflation.
How Is Inflation Calculated?
Historical inflation is commonly measured using the Consumer Price Index (CPI).
In the United States, the Bureau of Labor Statistics publishes CPI data to measure changes in prices paid by consumers.
Our historical calculator uses the Consumer Price Index for All Urban Consumers (CPI-U), US city average, all items, not seasonally adjusted.
The formula is:
Inflation-Adjusted Value = Original Amount × (Ending CPI ÷ Starting CPI)
For example, suppose:
| Detail | Value |
|---|---|
| Starting Amount | $1,000 |
| Starting CPI | 172.200 |
| Ending CPI | 321.943 |
The calculation becomes:
$1,000 × (321.943 ÷ 172.200) = $1,869.59
This means approximately $1,869.59 in the ending year would be needed to match the purchasing power of $1,000 in the starting year, according to the selected CPI measure.
The calculator performs these calculations automatically.
Inflation Calculator Example: 2000 to 2025
Suppose you want to know what $1,000 from the year 2000 would be worth in 2025.
The historical CPI-U annual averages are:
- 2000 CPI: 172.200
- 2025 CPI: 321.943
Using these values, the results are:
| Inflation Result | Value |
|---|---|
| Original Amount in 2000 | $1,000.00 |
| Equivalent Amount in 2025 | $1,869.59 |
| Dollar Difference | +$869.59 |
| Cumulative Inflation | +86.96% |
| Annualized Inflation | Approximately 2.53% |
| Purchasing Power Lost by Unchanged Cash | 46.51% |
Between 2000 and 2025, the general consumer price level increased by approximately 86.96% according to annual-average CPI-U.
In practical terms, maintaining the equivalent purchasing power of $1,000 from 2000 would require approximately $1,869.59 in 2025.
This does not mean every individual product increased in price by exactly 86.96%.
What Is Purchasing Power?
Purchasing power describes how much goods and services money can buy.
When prices increase but the amount of money stays the same, purchasing power usually decreases.
For example, $100 that previously purchased a certain basket of goods may no longer be enough to purchase that same basket after several years of inflation.
The calculator shows how purchasing power changes between your selected periods.
Purchasing Power Loss Formula
Purchasing Power Change = (Starting CPI ÷ Ending CPI − 1) × 100
Using our 2000-to-2025 example:
(172.200 ÷ 321.943 − 1) × 100 = −46.51%
That means an unchanged $1,000 would have approximately 46.51% less purchasing power in 2025 than it had in 2000 under this CPI comparison.
Inflation Rate vs. Purchasing Power Loss
These two percentages are not the same.
| Measurement | 2000–2025 Example |
|---|---|
| Consumer Price Increase | +86.96% |
| Purchasing Power Loss | 46.51% |
Prices increased by approximately 86.96%, but the corresponding purchasing-power loss of unchanged money was approximately 46.51%.
This difference occurs because purchasing power is calculated using the inverse of the price-level change.
How Much Has the US Dollar Changed Over Time?
Historical inflation data can help explain how the value of money has changed across decades.
The following example uses $1,000 in 2000 as the starting amount.
| Comparison Year | Equivalent Dollar Value | Cumulative Price Change |
|---|---|---|
| 2000 | $1,000.00 | 0.00% |
| 2010 | $1,266.30 | +26.63% |
| 2020 | $1,502.97 | +50.30% |
| 2025 | $1,869.59 | +86.96% |
These values use historical US CPI-U annual averages.
The table shows that the equivalent cost of a broad basket of consumer goods and services increased over time.
Actual price changes in individual cities, stores, or spending categories may have been different.
Cumulative Inflation vs. Annual Inflation
Understanding the difference between cumulative inflation and annual inflation is important when comparing prices across multiple years.
Cumulative Inflation
Cumulative inflation measures the total price-level change between two selected periods.
The formula is:
Cumulative Inflation = ((Ending CPI ÷ Starting CPI) − 1) × 100
For example, the cumulative CPI increase between 2000 and 2025 was approximately 86.96%.
Average Annualized Inflation
Annualized inflation expresses the total change as an equivalent compound annual rate across the comparison period.
The formula is:
Annualized Inflation = ((Ending CPI ÷ Starting CPI) ^ (1 ÷ Years) − 1) × 100
For the 25 years between 2000 and 2025, the equivalent annualized rate is approximately 2.53%.
This does not mean inflation was exactly 2.53% every year.
Actual annual inflation rates varied considerably during that period.
The calculator omits an annualized result when comparing a completed annual average with the separately labeled 2026 monthly observation.
Can You Calculate Inflation Backward?
Yes. The calculator allows you to select an earlier comparison year.
For example, suppose you want to know the equivalent purchasing power of $1,000 in 2025 expressed in 2000 dollars.
The calculation is:
$1,000 × (172.200 ÷ 321.943) = $534.88
This means approximately $534.88 in 2000 had equivalent purchasing power to $1,000 in 2025 according to the historical CPI data.
Reverse inflation calculations can be useful for comparing past salaries, historical prices, household budgets, and financial records.
How to Calculate Future Inflation
Historical inflation measures price changes that have already occurred.
Future inflation calculations estimate how prices might change based on an assumed annual rate.
The calculator uses:
[FV=P(1+i)^n]
Where:
- FV = projected future cost
- P = starting amount
- i = assumed annual inflation rate
- n = number of years
For example, suppose something costs $10,000 today and you assume annual inflation of 3% for the next 10 years.
The calculation is:
$10,000 × (1.03)¹⁰ = $13,439.16
Under this assumption, an item or collection of expenses costing $10,000 today could cost approximately $13,439.16 after 10 years.
This is a hypothetical projection, not a prediction of future inflation.
Future Inflation Calculator Example
Consider the following assumptions:
| Detail | Value |
|---|---|
| Current Amount | $10,000 |
| Expected Annual Inflation | 3.00% |
| Time Period | 10 years |
| Projected Future Cost | $13,439.16 |
| Additional Money Needed | $3,439.16 |
| Cumulative Price Increase | 34.39% |
| Future Purchasing Power of Unchanged $10,000 | $7,440.94 |
With 3% annual inflation, maintaining the same purchasing power after 10 years would require approximately 34.39% more money.
At the same time, $10,000 left unchanged would have purchasing power equivalent to approximately $7,440.94 in today's dollars.
How Much Will Inflation Increase Prices in 10 Years?
The impact of inflation depends on the rate assumed.
Consider an expense that costs $10,000 today.
| Annual Inflation | Cost After 10 Years | Total Price Increase |
|---|---|---|
| 2% | $12,189.94 | 21.90% |
| 3% | $13,439.16 | 34.39% |
| 4% | $14,802.44 | 48.02% |
A one-percentage-point difference in annual inflation can create a substantial difference over longer periods.
The calculator's Future Inflation Scenarios feature lets you explore lower, selected, and higher inflation assumptions.
These percentages are examples rather than forecasts.
How Inflation Affects Savings
Inflation matters when deciding how much money to save for long-term goals.
For example, suppose you save $20,000 and leave the amount unchanged for several years.
Even though the account may still display a balance of $20,000, its purchasing power can decrease if consumer prices rise.
At 3% inflation over 10 years, an unchanged $20,000 would have purchasing power equivalent to approximately $14,881.88 today.
This is why long-term savings plans often consider both account growth and inflation.
A savings balance may increase in nominal dollars while its purchasing power increases more slowly, stays approximately unchanged, or declines.
How Inflation Affects Your Salary
An inflation calculator can also help compare salaries from different years.
Suppose someone earned $50,000 annually in 2000.
To estimate the salary needed to maintain approximately equivalent purchasing power in 2025:
$50,000 × (321.943 ÷ 172.200) = $93,479.38
According to the CPI comparison, approximately $93,479 in 2025 would have similar general purchasing power to $50,000 in 2000.
This is not necessarily the salary someone should earn, and it does not account for changes in experience, productivity, career level, benefits, or local living costs.
It is a general price-level adjustment.
Salary Inflation vs. Salary Increase
A salary increase does not always represent an improvement in purchasing power.
If your salary increases by 3% while the price level increases by 5%, your purchasing power may decline despite earning more dollars.
Comparing income changes with inflation can help distinguish nominal raises from changes in real purchasing power.
What Is the Consumer Price Index (CPI)?
The Consumer Price Index measures changes in the prices paid by consumers for a representative selection of goods and services.
The US Bureau of Labor Statistics publishes several CPI measures.
Our calculator uses CPI-U: All Urban Consumers, US City Average, All Items, Not Seasonally Adjusted.
This measure covers a broad range of consumer expenditures, including housing, food, transportation, apparel, medical care, recreation, and other goods and services.
CPI is widely used for economic analysis, inflation adjustments, and historical purchasing-power comparisons.
CPI vs. Personal Cost of Living
CPI represents an average consumer price measure.
Your personal inflation experience may differ because of:
- Where you live
- Your housing expenses
- Transportation needs
- Family size
- Healthcare spending
- Food preferences
- Personal shopping habits
For example, someone who spends a large share of income on housing may experience different cost changes than someone with much lower housing expenses.
An inflation calculator provides a broad purchasing-power estimate, not an individualized household budget.
Understanding Historical CPI Data in This Calculator
The calculator contains historical annual-average US CPI-U values from 1913 through 2025.
It also includes a separately labeled September 2026 monthly CPI observation, with a CPI-U index of 336.940.
This data snapshot was verified on October 17, 2026.
Why Is 2026 Shown Separately?
A complete annual CPI average represents the average index over a calendar year.
Because 2026 has not yet ended, the calculator does not treat the September 2026 monthly CPI as a completed annual-average figure.
Users can compare a previous annual CPI average with the September 2026 observation, but the tool identifies that the periods are different.
Does the Calculator Update Automatically?
No. The historical CPI data is bundled into the calculator.
This means historical calculations can run without relying on an external data request, but the dataset must be updated when newer official CPI figures become available.
Future inflation mode does not depend on the bundled CPI series because it uses the annual rate entered by the user.
How to Read the Inflation Over Time Chart
The Inflation Over Time chart provides a visual representation of how dollar values change across your selected period.
In Historical Inflation mode, it uses recorded CPI data to display the equivalent dollar value across the available years.
In Future Inflation mode, it projects values using your selected annual inflation assumption.
The comparison line represents the original unchanged dollar amount, making it easier to see how inflation affects the amount required to maintain purchasing power.
The chart is especially useful for understanding long-term changes that may not seem significant from one year to the next.
Understanding the Year-by-Year Inflation Breakdown
The calculator includes a year-by-year table for users who want more detailed information.
Historical Inflation Table
The historical table shows:
| Column | Meaning |
|---|---|
| Year | Historical calendar year |
| CPI-U | Recorded Consumer Price Index value |
| Annual CPI Change | Percentage change from the previous year's annual average |
| Equivalent Value | Inflation-adjusted dollar amount |
| Change Since Start | Cumulative price-level change |
Future Inflation Table
The future table shows the assumed inflation rate, projected cost, purchasing power of unchanged cash, and cumulative inflation for each year.
The calculator initially displays a shorter selection of rows.
Select Show All Years to review the complete available breakdown.
Inflation vs. Investment Returns
Inflation and investment returns are different measurements.
Inflation measures changes in the general price level.
Investment returns measure changes in the value of an investment, including applicable income and gains or losses.
An investment may earn a positive nominal return while providing a smaller inflation-adjusted return.
For example, if an investment earns 5% over one year while prices increase by 3%, its approximate real return is 1.94%.
The relationship is:
Real Return = ((1 + Nominal Return) ÷ (1 + Inflation Rate) − 1) × 100
This illustrates why purchasing power matters when evaluating long-term financial goals.
The Inflation Calculator measures or projects price changes; it does not predict investment performance.
Can Inflation Be Negative?
Yes. A sustained decline in the general price level is known as deflation.
Deflation means that an unchanged amount of money may gain purchasing power as overall prices fall.
The Future Inflation Calculator supports negative annual inflation assumptions.
For example, a negative annual rate produces a declining projected price level under the calculator's constant-rate model.
Historical mode also supports comparisons between years in which the measured price level decreased.
The tool should not automatically describe every purchasing-power change as a loss.
Common Mistakes When Calculating Inflation
Confusing Cumulative Inflation With Annual Inflation
An 80% total price increase over several decades does not mean inflation was 80% every year.
Cumulative and annualized inflation measure different things.
Assuming Inflation Affects Every Product Equally
National CPI figures describe a broad average, not the exact price change of every product or service.
Using an Incorrect Starting Year
Historical calculations depend on the chosen CPI reference period. Selecting the wrong starting year changes the result.
Treating Future Inflation as Guaranteed
Future inflation cannot be known in advance.
The calculator's projected values depend entirely on the rate assumed.
Confusing Annual CPI With Monthly CPI
Annual-average and monthly indexes represent different reference periods.
They should not be presented as equivalent observations.
Ignoring Purchasing Power When Planning Savings
A larger future dollar balance does not automatically mean greater real purchasing power.
Long-term planning benefits from considering both nominal amounts and inflation.
How Accurate Is the Inflation Calculator?
The historical calculation uses published US CPI-U index values and standard CPI-ratio formulas.
Its mathematical results are accurate for the selected index observations, subject to the precision of the source data.
However, the results represent general national price-level changes rather than the exact costs experienced by an individual household.
Future inflation results are assumption-based projections and are not guaranteed.
The calculator also does not model regional consumer price differences, individual spending patterns, exchange rates, investment earnings, or taxes.
Related Finance Calculators
Explore these related Skills Elevate tools to understand inflation alongside savings and long-term financial planning.
- Savings Calculator — estimate how savings may grow through deposits and interest.
- Compound Interest Calculator — calculate investment or savings growth from compounding.
- Retirement Savings Calculator — estimate retirement balances and long-term savings goals.
- Simple Interest Calculator — understand interest calculations without compounding.
Frequently Asked Questions
What is an Inflation Calculator?
An Inflation Calculator measures how the purchasing power of money changes between different years or estimates how future prices may change using an assumed inflation rate.
How do I calculate inflation between two years?
Divide the ending CPI by the starting CPI, subtract one, and multiply by 100 to get the cumulative inflation percentage.
The calculator performs this calculation automatically using its bundled historical data.
How much is $1,000 from 2000 worth in 2025?
According to US CPI-U annual-average data, $1,000 in 2000 had purchasing power equivalent to approximately $1,869.59 in 2025.
How much has the US dollar lost in purchasing power?
The answer depends on the starting and ending periods.
For example, from 2000 to 2025, an unchanged dollar lost approximately 46.51% of its purchasing power under the CPI-U annual-average comparison.
What is the difference between inflation and purchasing power?
Inflation describes changes in the general price level, while purchasing power describes how much money can buy.
When prices rise, unchanged money generally loses purchasing power.
How do I calculate future inflation?
Multiply the starting amount by one plus the assumed annual inflation rate, raised to the number of years.
For example:
Future Cost = Starting Amount × (1 + Inflation Rate) ^ Years
What will $10,000 be worth in 10 years?
At an assumed inflation rate of 3% annually, an unchanged $10,000 would have purchasing power equivalent to approximately $7,440.94 today after 10 years.
The equivalent future cost of goods currently priced at $10,000 would be approximately $13,439.16.
What inflation rate should I use for future planning?
There is no universally correct rate for every future period.
You can compare different hypothetical rates, such as 2%, 3%, and 4%, to understand how your results change.
The selected rate should be treated as an assumption, not a forecast.
Is CPI the same as inflation?
CPI is a price index used to measure inflation.
Inflation rates are calculated from changes in the CPI index or another price-level measure over time.
Does the calculator use real US inflation data?
Yes. Historical mode uses bundled CPI-U annual-average data from the US Bureau of Labor Statistics for 1913–2025, with an additional separately labeled September 2026 monthly observation.
Can I calculate inflation before 1913?
Not with the historical mode of this calculator.
Its historical CPI series begins in 1913. Earlier price comparisons require different historical datasets and assumptions.
Can I compare 2025 with 1980?
Yes. Select 2025 as one year and 1980 as the other. The calculator supports comparisons in either direction.
What happens if I select the same starting and ending year?
The inflation-adjusted amount remains the same, with 0% cumulative inflation between identical annual CPI reference periods.
Does inflation always increase?
No. Prices can decrease during deflationary periods, and inflation can slow even when the overall price level continues rising.
Can I use this calculator to compare salaries?
Yes. Enter a historical salary and select two years to estimate its equivalent purchasing power based on national CPI-U data.
This does not account for changes in role, experience, benefits, or local wage conditions.
Does the Inflation Calculator include housing prices?
CPI-U includes housing-related consumer costs, but it does not directly measure home purchase prices in the same way as a house price index.
For individual housing-price comparisons, a specialized housing index may be more appropriate.
Is this calculator suitable for retirement planning?
It can help illustrate how inflation may affect future purchasing power, making it useful alongside dedicated savings and retirement calculators.
It does not create a complete retirement plan or project investment performance.
Does this tool automatically fetch the latest CPI?
No. The calculator uses a bundled historical dataset that needs periodic updates.
It displays the data coverage so users can distinguish the latest included observation from future projections.
Is the Inflation Calculator free?
Yes. The Skills Elevate Inflation Calculator is free to use for historical US CPI comparisons, purchasing-power estimates, and future inflation scenarios.