
Standard Deviation Calculator
Calculate mean, variance and standard deviation from a list of numbers.
What Is a Standard Deviation Calculator?
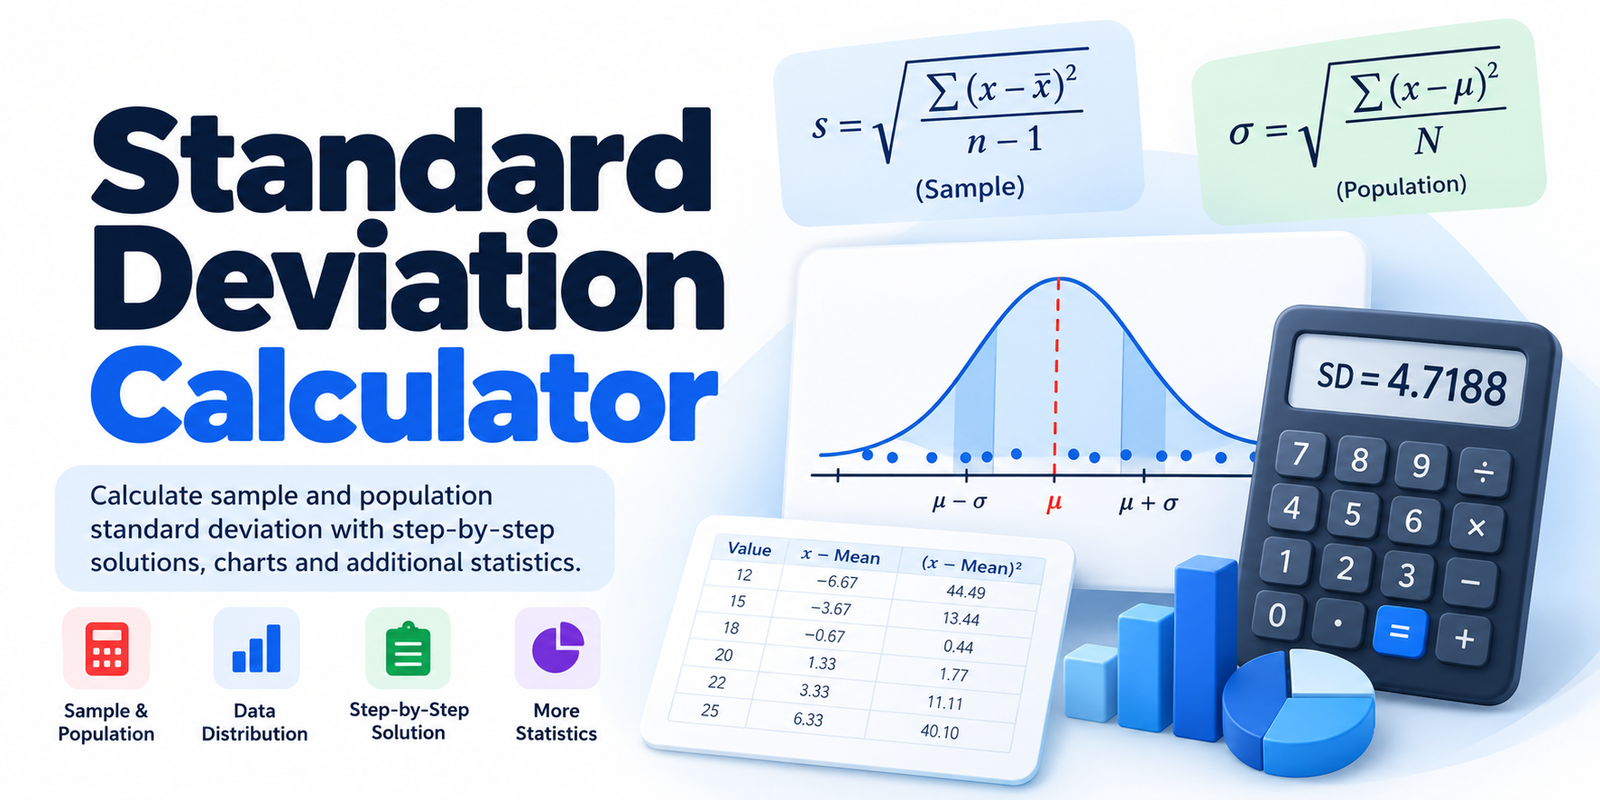
A Standard Deviation Calculator is a free online tool that measures how spread out numerical values are around their mean (average). It helps students, teachers, researchers, and professionals understand variability in a dataset without performing complicated calculations manually.
Standard deviation is one of the most widely used measures of statistical dispersion. A smaller standard deviation indicates that values are more closely grouped around the mean, while a larger standard deviation indicates greater spread.
Our free Standard Deviation Calculator supports both sample standard deviation (s) and population standard deviation (σ).
Simply enter your numbers, select the calculation method, and view your results instantly.
The calculator also provides variance, mean, number of observations, median, range, a data distribution graph, and a step-by-step solution.
You can adjust decimal precision, copy your results, or download your calculations as a CSV file.
How to Use the Standard Deviation Calculator
The SkillsElevate Standard Deviation Calculator is designed for beginners and experienced statistics users.
Follow these steps to calculate standard deviation accurately.
Step 1: Enter Your Dataset
Enter or paste your numerical values into the dataset input field.
For example:
12, 15, 18, 20, 22, 25
You can separate numbers using commas, spaces, tabs, or new lines.
The calculator supports positive numbers, negative numbers, zero, and decimal values.
You can also paste numerical data directly from a spreadsheet.
Step 2: Choose the Calculation Type
Select one of the following options:
Sample (s): Use this when your dataset represents a sample from a larger population.
Population (σ): Use this when your dataset represents the entire group you want to describe.
This selection determines which formula the calculator applies.
Step 3: Calculate Standard Deviation
Click Calculate to process the dataset.
The tool displays the standard deviation as the primary result.
It also calculates the mean, variance, and total number of observations.
Step 4: Explore Your Data Distribution
Open the Data Distribution feature to see how the values are distributed around the mean.
Smaller datasets are shown using individual dots, while larger datasets may be displayed as a histogram.
Step 5: Review the Step-by-Step Solution
Select Step-by-Step to understand the mathematical process.
The calculator displays individual deviations, squared deviations, variance, and the final standard deviation calculation.
Step 6: View Additional Statistics
Open More Statistics to explore the median, minimum, maximum, range, sum, and coefficient of variation.
Step 7: Copy or Download Your Results
Use Copy Result to save the calculated statistics.
You can also select Download CSV to export a summary and the complete deviation table.
What Is Standard Deviation in Statistics?
Standard deviation is a statistical measure describing how much the values in a dataset vary around the mean.
It helps explain whether observations are tightly clustered or widely dispersed.
Consider two datasets:
Dataset A: 48, 49, 50, 51, 52
Dataset B: 30, 40, 50, 60, 70
Both datasets have the same mean of 50.
However, the values in Dataset A are concentrated close to 50, while Dataset B contains values spread much farther away.
Therefore, Dataset B has a higher standard deviation.
This demonstrates why the mean alone does not fully describe a dataset.
Two groups can have identical averages but very different levels of variability.
Standard deviation provides information about that spread.
Sample Standard Deviation vs. Population Standard Deviation
One of the most important decisions when calculating standard deviation is choosing between sample and population calculations.
Although both measure variability, they use different denominators.
What Is Sample Standard Deviation?
Sample standard deviation measures the variability in observations treated as a sample from a larger population.
For example, a researcher might collect test scores from 30 students to study performance across a much larger student population.
Because the observations represent a sample, the sample standard deviation formula is appropriate.
Sample Standard Deviation Formula:
s = √[Σ(x − x̄)² ÷ (n − 1)]
Where:
- s = sample standard deviation
- Σ = sum of values
- x = individual observation
- x̄ = sample mean
- n = number of observations
The sample formula divides the sum of squared deviations by n − 1 rather than n.
This denominator is associated with Bessel's correction, which makes sample variance an unbiased estimator of population variance under standard random-sampling assumptions.
The sample standard deviation itself is not generally an unbiased estimator of population standard deviation.
What Is Population Standard Deviation?
Population standard deviation measures variability across the entire population being analyzed.
For example, if a teacher wants to describe the exam scores of every student in one particular class, the population formula can be used when those students constitute the complete group of interest.
Population Standard Deviation Formula:
σ = √[Σ(x − μ)² ÷ N]
Where:
- σ = population standard deviation
- Σ = sum of values
- x = individual observation
- μ = population mean
- N = total number of observations
Unlike the sample formula, population variance divides the sum of squared deviations by N.
Sample vs. Population Standard Deviation Comparison
| Feature | Sample | Population |
|---|---|---|
| Symbol | s | σ |
| Variance symbol | s² | σ² |
| Denominator | n − 1 | N |
| Data scope | Sample of a larger population | Entire population of interest |
| Minimum values needed | 2 | 1 |
| Primary purpose | Describe sample variability and estimate population spread | Describe complete population variability |
For the same dataset containing more than one value, sample standard deviation is larger than population standard deviation because the sample formula uses a smaller denominator.
How to Calculate Standard Deviation Step by Step
Let's calculate standard deviation manually using a simple dataset.
Dataset: 2, 4, 6, 8, 10
We will calculate both the sample and population standard deviation.
Step 1: Calculate the Mean
First, add all observations.
2 + 4 + 6 + 8 + 10 = 30
Divide the sum by the number of observations.
Mean = 30 ÷ 5
Mean = 6
Step 2: Calculate Each Deviation From the Mean
Subtract the mean from every observation.
| Value (x) | Mean | x − Mean |
|---|---|---|
| 2 | 6 | −4 |
| 4 | 6 | −2 |
| 6 | 6 | 0 |
| 8 | 6 | 2 |
| 10 | 6 | 4 |
These differences are called deviations.
They show how far each observation is above or below the mean.
Step 3: Square Each Deviation
Square every deviation to remove its negative sign and give greater weight to larger differences.
| Value | Deviation | Squared Deviation |
|---|---|---|
| 2 | −4 | 16 |
| 4 | −2 | 4 |
| 6 | 0 | 0 |
| 8 | 2 | 4 |
| 10 | 4 | 16 |
| Total | 0 | 40 |
The sum of squared deviations is:
Σ(x − Mean)² = 40
Step 4: Calculate Variance
For population variance, divide by the total number of observations.
Population Variance = 40 ÷ 5
Population Variance = 8
For sample variance, divide by n − 1.
Sample Variance = 40 ÷ (5 − 1)
Sample Variance = 40 ÷ 4
Sample Variance = 10
Step 5: Calculate Standard Deviation
Take the square root of the variance.
Population Standard Deviation:
√8 = 2.8284
Sample Standard Deviation:
√10 = 3.1623
Final Results
| Statistic | Result |
|---|---|
| Mean | 6 |
| Count | 5 |
| Population Variance | 8 |
| Sample Variance | 10 |
| Population Standard Deviation | 2.8284 |
| Sample Standard Deviation | 3.1623 |
These results illustrate how the same dataset produces different standard deviations depending on the selected calculation method.
Standard Deviation Calculator Example
Consider the following dataset entered into SkillsElevate:
12, 15, 18, 20, 22, 25
The calculator automatically detects six observations.
| Statistic | Result |
|---|---|
| Number of values | 6 |
| Sum | 112 |
| Mean | 18.6667 |
| Sample Variance | 22.2667 |
| Sample Standard Deviation | 4.7188 |
| Population Variance | 18.5556 |
| Population Standard Deviation | 4.3076 |
When Sample is selected, the main result is 4.7188.
Switching to Population changes the main result to 4.3076.
The dataset remains unchanged, allowing you to compare the methods immediately.
What Is Variance in Statistics?
Variance measures the average squared deviation of observations from their mean.
It is directly related to standard deviation.
Variance = (Standard Deviation)²
Standard Deviation = √Variance
The major difference is how their units are expressed.
Variance is measured in squared units, while standard deviation uses the same units as the original data.
For example, if a dataset contains measurements in inches:
- Variance is expressed in square inches.
- Standard deviation is expressed in inches.
This makes standard deviation particularly useful when interpreting variability in real-world measurements.
Variance vs. Standard Deviation
| Feature | Variance | Standard Deviation |
|---|---|---|
| Measures variability | Yes | Yes |
| Uses squared deviations | Yes | Yes |
| Final calculation | Divide squared-deviation sum | Square root of variance |
| Units | Squared units | Original units |
| Can be negative | No | No |
Both statistics are useful, but standard deviation is generally easier to interpret alongside the original observations.
How to Interpret Standard Deviation
Standard deviation is not simply a number to calculate. It helps explain how consistent or variable observations are.
Low Standard Deviation
A low standard deviation means values are relatively close to their mean.
For example, exam scores of 78, 79, 80, 81, and 82 have little variation.
High Standard Deviation
A high standard deviation means values are more widely spread around the mean.
For example, scores of 40, 60, 80, 90, and 100 show substantially greater variability.
Zero Standard Deviation
A standard deviation of zero means every observation has the same value.
For example:
10, 10, 10, 10, 10
The mean is 10, and every deviation is zero.
Therefore, both population and sample standard deviation equal zero, provided the sample contains at least two observations.
Is a High Standard Deviation Bad?
Not necessarily.
A high standard deviation indicates greater variability, but whether that is desirable depends on the situation.
In manufacturing, excessive variability may indicate inconsistent output.
In other datasets, greater variation may be expected or meaningful.
Standard deviation should be interpreted relative to the data's units, mean, context, and distribution.
What Is the Empirical Rule in Statistics?
The empirical rule describes an approximate relationship between standard deviation and observations in a normal, bell-shaped distribution.
It is also called the 68–95–99.7 rule.
For an approximately normal distribution:
| Distance From Mean | Approximate Percentage |
|---|---|
| Within ±1 standard deviation | 68% |
| Within ±2 standard deviations | 95% |
| Within ±3 standard deviations | 99.7% |
For example, suppose test scores follow an approximately normal distribution with:
Mean = 70
Standard Deviation = 10
About 68% of observations would fall between 60 and 80.
About 95% would fall between 50 and 90.
About 99.7% would fall between 40 and 100.
Important: This rule applies to approximately normal distributions. It should not be assumed for every dataset, especially those with strong skewness or unusual outliers.
Understanding the Data Distribution Chart
The SkillsElevate Standard Deviation Calculator includes a visual distribution tool to make variability easier to understand.
Individual Data Points
For smaller datasets, individual observations appear as dots.
This helps users identify clustering, gaps, and repeated values.
Histogram View
For larger datasets, the calculator displays observations in grouped intervals, called bins.
A histogram makes it easier to examine the overall distribution without displaying hundreds of individual dots.
Mean Reference Line
A dashed vertical line marks the calculated mean.
It shows the central reference point used when calculating deviations.
Standard Deviation Range
A highlighted region represents the interval from one standard deviation below the mean to one standard deviation above it.
This visual helps explain how observations are distributed relative to the mean.
The shaded region is a reference interval, not a confidence interval or a guarantee that a particular percentage of observations lies inside it.
Additional Statistics Explained
The calculator provides several descriptive statistics beyond standard deviation.
Mean
The mean is the sum of all observations divided by the total number of observations.
It represents the arithmetic average.
Median
The median is the middle value when observations are arranged in ascending order.
For an even number of observations, the median is the average of the two central values.
Minimum and Maximum
The minimum is the smallest observation in the dataset.
The maximum is the largest.
These values help identify the dataset's overall boundaries.
Range
Range measures the difference between the largest and smallest observation.
Range = Maximum − Minimum
Unlike standard deviation, range uses only two observations.
Sum
The sum is the total of all numerical observations.
It is useful when checking data or calculating the mean.
Coefficient of Variation
The coefficient of variation (CV) expresses standard deviation relative to the mean.
A common formula is:
CV = (Standard Deviation ÷ Mean) × 100%
CV is most meaningful when comparing suitable positive, ratio-scale measurements with nonzero means.
The SkillsElevate calculator reports the magnitude of this ratio when the mean is nonzero and marks it undefined when the mean equals zero.
For data with negative means, interval scales, or values close to zero, coefficient-of-variation comparisons may be misleading.
Standard Deviation vs. Standard Error
Standard deviation and standard error are related statistical concepts, but they answer different questions.
Standard Deviation describes the variability of individual observations in a dataset.
Standard Error of the Mean describes the estimated variability of sample means across repeated samples.
A common formula for the estimated standard error of the mean is:
SE = s ÷ √n
Where:
- SE = estimated standard error
- s = sample standard deviation
- n = sample size
As the sample size increases, the standard error generally decreases when the underlying variability remains comparable.
The SkillsElevate Standard Deviation Calculator calculates standard deviation and variance. It should not be confused with a confidence interval or a complete statistical inference tool.
Real-World Applications of Standard Deviation
Standard deviation is used in many fields to describe variation.
Education and Test Scores
Teachers and researchers use standard deviation to understand how widely student scores vary around the class average.
Two classes may have similar average scores but different levels of score variability.
Business Analytics
Businesses can calculate standard deviation for sales, order values, production times, and customer activity.
This helps analysts understand consistency and identify unusual variation.
Manufacturing and Quality Control
Manufacturers use variability measures to assess production consistency.
For example, standard deviation can help describe differences in product dimensions or processing times.
Finance and Investment Analysis
Standard deviation is used to describe the historical variability of financial returns.
However, it does not capture every form of financial risk and should not be interpreted as a complete measure of investment safety.
Scientific Research
Researchers use standard deviation to summarize variability in measurements and experimental observations.
It often accompanies the mean when reporting descriptive statistics.
Can Standard Deviation Be Negative?
No.
Standard deviation cannot be negative because it is calculated as the nonnegative square root of variance.
Variance is based on squared deviations, which are nonnegative.
The result is therefore always greater than or equal to zero.
However, the original dataset may contain negative numbers.
For example, a dataset containing −10, −5, 0, 5, and 10 still has a valid, nonnegative standard deviation.
How Do Outliers Affect Standard Deviation?
Outliers are unusually large or small observations compared with the rest of a dataset.
Because standard deviation uses squared deviations, observations far from the mean can have a substantial influence on the result.
For example:
Dataset A: 10, 11, 12, 13, 14
Dataset B: 10, 11, 12, 13, 100
Dataset B has a much larger standard deviation because the value 100 is far from the other observations.
This sensitivity can be useful for detecting variability, but it also means standard deviation may not fully describe heavily skewed datasets.
For such datasets, the median and interquartile range may provide helpful additional context.
Common Standard Deviation Calculation Mistakes
Choosing the Wrong Formula
Using the population formula when the observations represent a sample can produce a different result.
Always select the method based on the purpose of your analysis.
Forgetting to Square Deviations
The formula requires squaring each difference from the mean.
Simply adding signed deviations would produce zero or a value close to zero because positive and negative deviations cancel.
Dividing by the Wrong Number
Sample variance uses n − 1, while population variance uses N.
This is a common source of errors in statistics assignments.
Rounding Intermediate Values
Rounding the mean or squared deviations too early can affect the final result.
Keep sufficient precision throughout the calculation and round only for display.
Confusing Variance With Standard Deviation
Variance uses squared units. Standard deviation is the square root of variance.
They are related but are not interchangeable.
Ignoring Outliers
Extreme observations can substantially increase standard deviation.
Examine the dataset and use the distribution chart to understand unusual values.
Entering Invalid Data
Only numerical observations should be included.
Do not insert text labels, currency symbols, or thousands separators into the data field.
For example, enter 1200 rather than 1,200 if you mean one thousand two hundred, because the calculator treats commas as value separators.
Frequently Asked Questions
What is a Standard Deviation Calculator?
A Standard Deviation Calculator is a tool that measures how much numerical observations vary around their mean. It can calculate sample or population standard deviation, variance, and other descriptive statistics.
How do I calculate standard deviation?
Find the mean, subtract it from each value, square the deviations, add the squared results, divide by n − 1 or N, and take the square root.
What is the difference between sample and population standard deviation?
Sample standard deviation uses n − 1 in the variance calculation, while population standard deviation uses N. The appropriate method depends on whether the dataset is treated as a sample or the complete population of interest.
When should I use sample standard deviation?
Use sample standard deviation when analyzing a subset of observations intended to represent a larger population.
Can standard deviation be zero?
Yes. Standard deviation equals zero when all observations are identical. Population standard deviation can also be zero for a dataset containing one observation.
Can standard deviation be negative?
No. Standard deviation is always nonnegative, even when the dataset contains negative numbers.
Is standard deviation the same as variance?
No. Variance is based on squared deviations, while standard deviation is the square root of variance.
How do I calculate standard deviation in Excel?
For numerical values in cells A1 through A10, use =STDEV.S(A1:A10) for sample standard deviation or =STDEV.P(A1:A10) for population standard deviation.
What does a high standard deviation mean?
A high standard deviation means observations are widely spread around the mean relative to the data's units and context. It does not automatically indicate a problem.
What does a low standard deviation mean?
A low standard deviation means observations are relatively close to the mean.
How do outliers affect standard deviation?
Outliers can substantially increase standard deviation because the formula squares deviations from the mean.
Can I calculate standard deviation with decimal or negative numbers?
Yes. The SkillsElevate calculator supports valid positive numbers, negative numbers, decimals, and zero.
What happens if I enter only one number?
Population standard deviation is zero for a single observation. Sample standard deviation is undefined because its denominator would be zero.
Does the calculator show calculation steps?
Yes. The Step-by-Step feature displays the mean, individual deviations, squared deviations, variance, and final standard deviation.
Can I download standard deviation results?
Yes. You can download a CSV file containing the calculated statistics and a complete deviation table.
How many numbers can I enter?
The SkillsElevate calculator supports up to 5,000 numerical observations in one calculation.
Is the Standard Deviation Calculator free?
Yes. The SkillsElevate Standard Deviation Calculator is free to use and does not require registration.
Mathematical Methodology and References
The SkillsElevate Standard Deviation Calculator uses the conventional sample and population standard deviation formulas.
Its methodology is consistent with established introductory statistics references, including:
OpenStax — Introductory Statistics: Measures of the Spread of the Data.
OpenStax — Introductory Business Statistics: Measures of the Spread of the Data.
NIST/SEMATECH — e-Handbook of Statistical Methods: Descriptive statistical measures and variability.
The calculator uses a numerically stable, scaled variance calculation to reduce certain floating-point precision problems.
Results are rounded only for display, and the user can choose the number of displayed decimal places.
Very large values or datasets that exceed the supported numerical range may be rejected to prevent misleading results.
Related Tools
Explore other mathematics and educational calculators available on SkillsElevate:
- Slope Calculator — Calculate the slope of a line using coordinate values.
- GPA Calculator — Calculate grade point averages using grades and credits.
Additional related statistics tools can be linked here as they become available on SkillsElevate.
Calculate Standard Deviation With Confidence
The free Standard Deviation Calculator from SkillsElevate makes it easier to measure variability, calculate descriptive statistics, and understand how numerical values are distributed.
Whether you are completing a statistics assignment, analyzing business figures, or reviewing research measurements, the tool provides both sample and population calculations with clear results.
Enter your dataset, select the appropriate method, and explore the distribution graph, step-by-step solution, and additional statistics.
You can also copy your results or download a CSV file for future reference.